A Forecast With a Date on It
What the Andromeda forecast should become after Gaia DR4, stated before the data arrive
pre-dr4-forecast-v1
Gaia Data Release 4: 2 December 2026
Part one of this research found that the Milky Way–Andromeda forecast hinges on one number: how fast Andromeda drifts sideways across our sky. One re-measurement of that drift turned a 2025 “coin flip” into a 2026 “90%”.
On 2 December 2026 the European Space Agency releases Gaia Data Release 4, built on 66 months of observations. Better measurements of Andromeda’s drift will follow in the weeks and months after. When they arrive, it will be easy to tell a convincing story about whatever the new number turns out to be. This page removes that option. It writes down, before the data exist, what the forecast should become for every plausible new measurement, and the exact rule for updating it.
The research in five stages
Each stage answers one question, in an order chosen so that no claim gets ahead of its evidence: reproduce first, commit before the new data, then test and interpret, then update in public. Stages 1 and 2 had to finish before Gaia Data Release 4 on 2 December 2026. Andromeda’s motion from DR4 must be derived by astronomers after the release, which may take weeks to months, so Stage 5 waits for it.
-
Stage 1
Reproduce the published forecasts
Complete · 28 Oct 2026
Re-run both studies and match their numbers. A forecast you cannot reproduce cannot be tested.
Read Stage 1 → -
Stage 2
Commit a forecast before Gaia DR4
Complete · 1 Nov 2026
Write down, before new data exist, what would raise, lower, or leave the forecast unchanged.
You are here -
Stage 3
Stress-test the model
From Dec 2026
Find where the model could be wrong: dark-matter halos, friction at close range, the Sun’s frame.
Planned -
Stage 4
Connect the consequences
From Dec 2026, alongside Stage 3
Put Earth, the Sun, and the galaxies on one timeline, including what happens before any collision.
Planned -
Stage 5
Update against Gaia DR4
When DR4-based measurements appear
Apply the fixed rule and publish the new forecast beside the old one, whatever it says.
Planned
1Today’s forecast
The frozen forecast is my reproduction of the 2026 study by Wu and colleagues: 90.1% of 10,000 simulated futures end in a merger within 9.8 billion years (sampling uncertainty 89.5–90.7%). It uses Andromeda’s sideways drift as measured in 2025, 45.9 ± 8.1 micro-arcseconds per year eastward and −20.5 ± 6.6 northward. Every other input, the code version, and the random seeds are frozen at the git tag above.
2What counts as a change
Before computing any map, I fixed what “materially changed” means and committed it to the public repository, where the timestamp is visible:
| Category | Updated forecast |
|---|---|
| Raise | 95.1% or higher |
| Unchanged | between 85.1% and 95.1% |
| Lower | 85.1% or lower |
Five percentage points is about 17 times the forecast’s own sampling noise, so a change that large is not a fluke of the simulation. Any result below 50% is also flagged as a return to the 2025 “coin flip” headline. A result that lands within the noise of a boundary is reported as borderline.
3The map
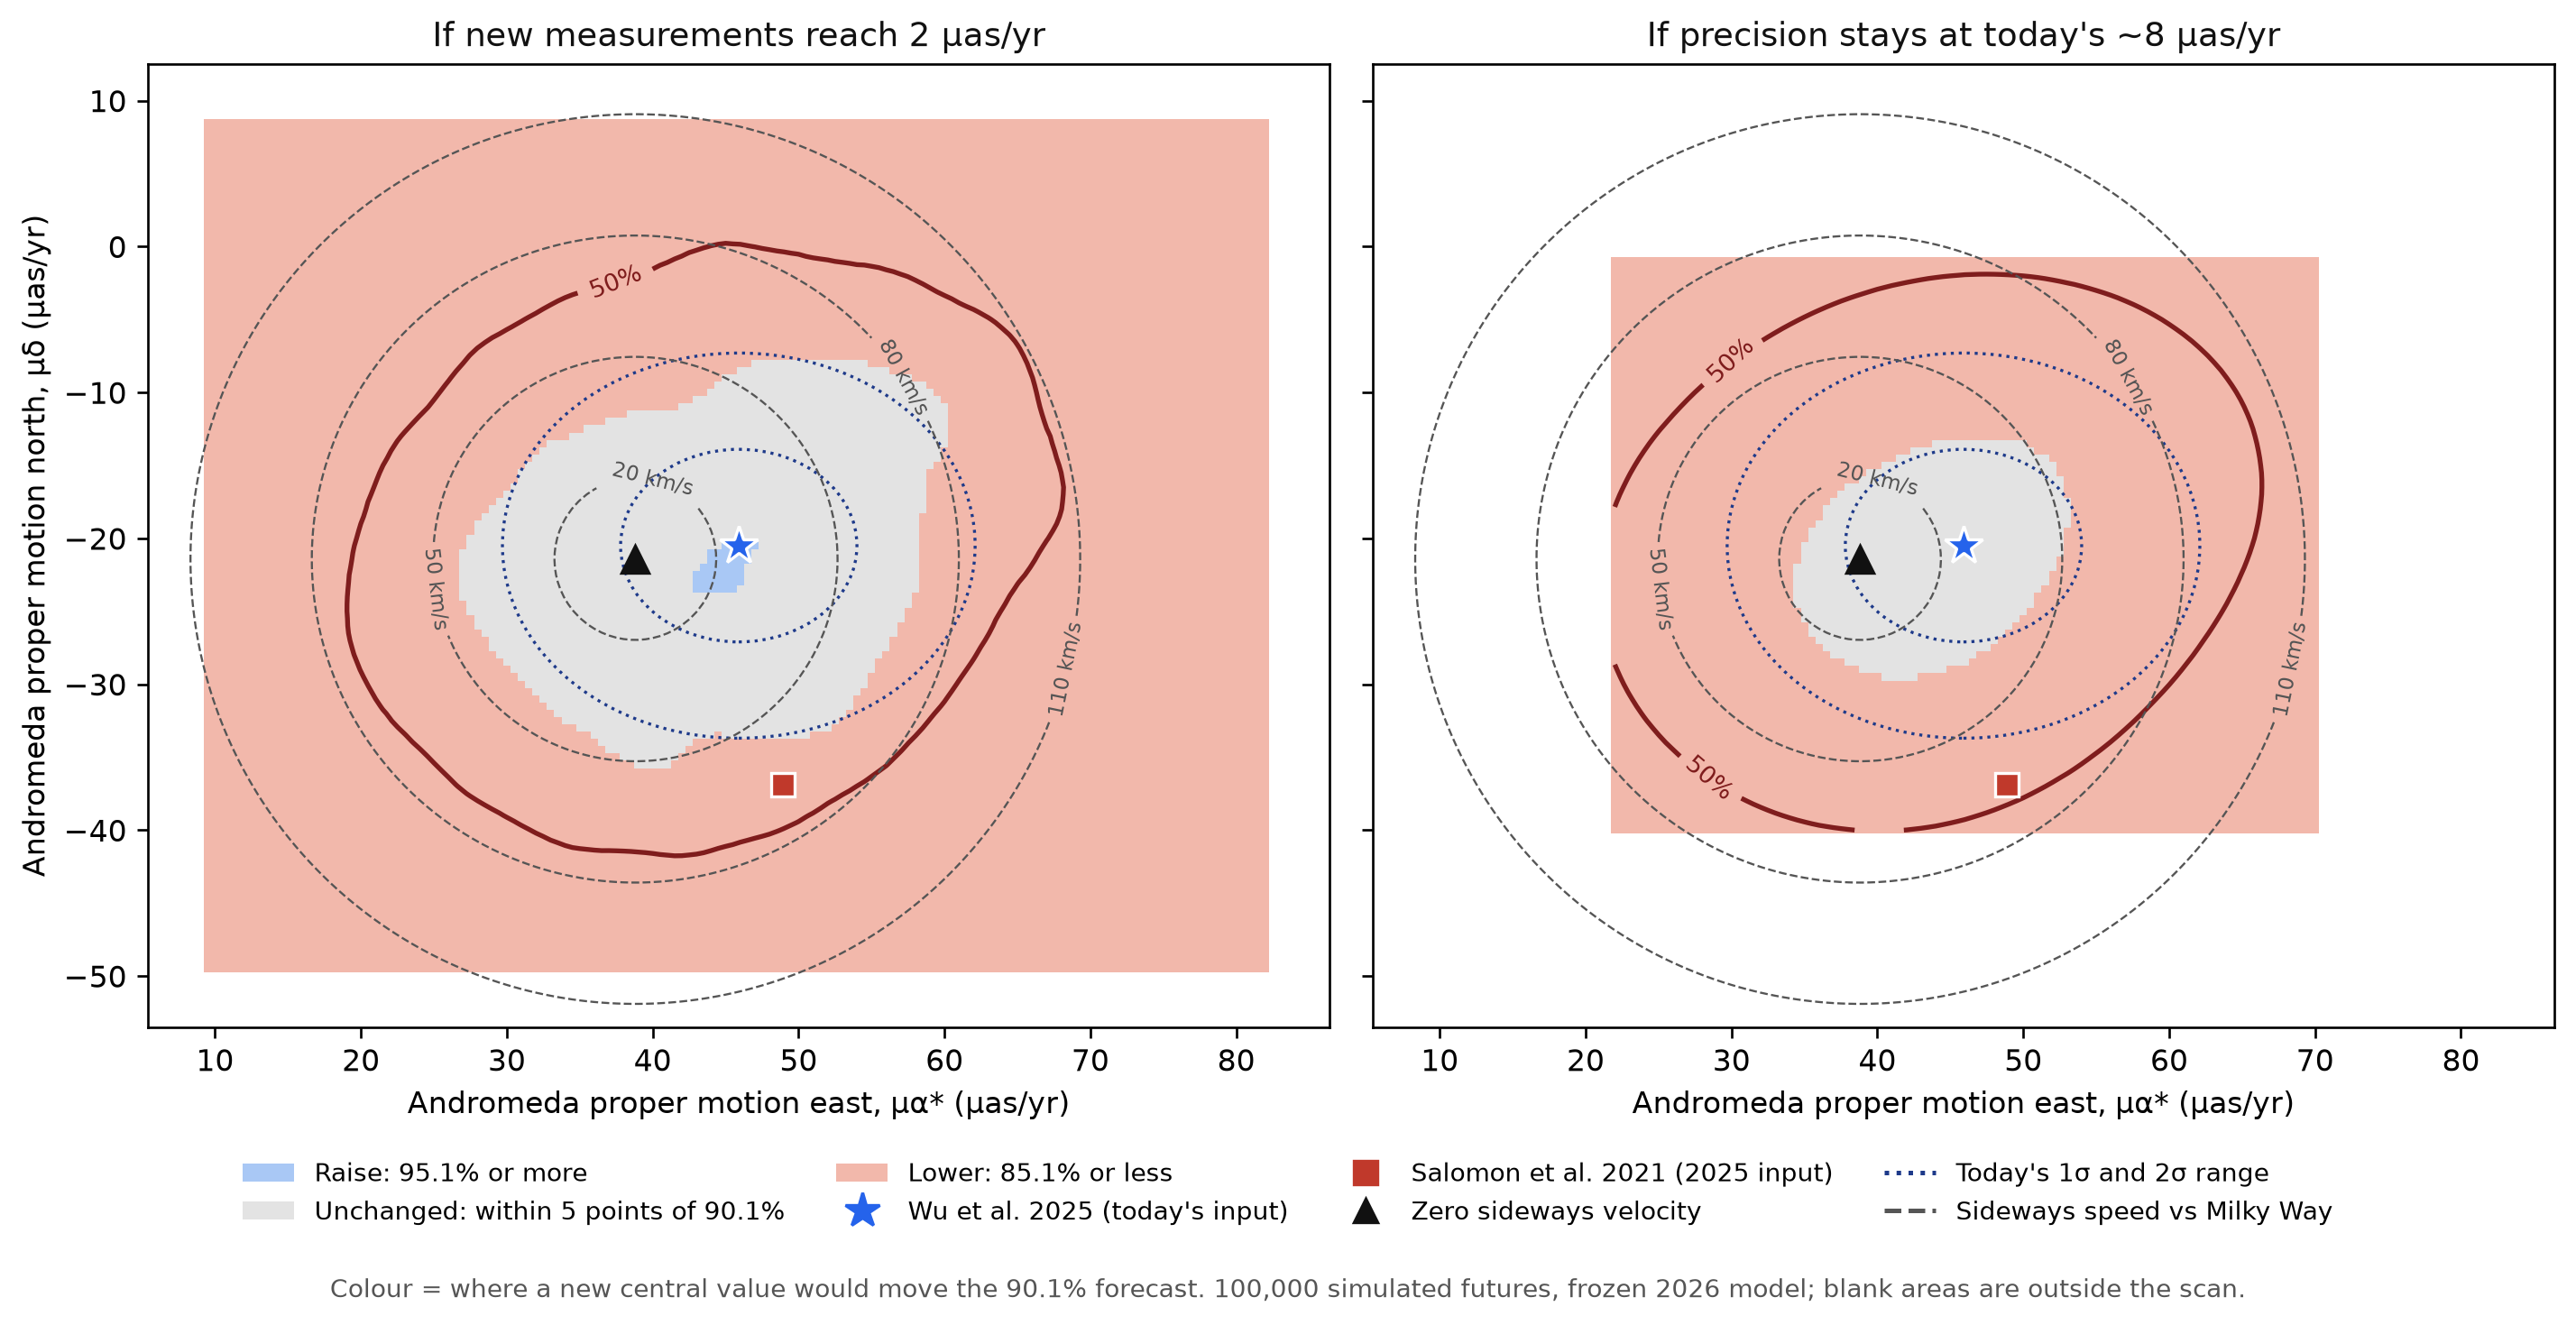
To see where a new measurement could land, I re-ran the frozen model 100,000 times, letting Andromeda’s drift range uniformly over a wide box (five times today’s uncertainty in every direction) while every other input kept its usual range. From those runs, the forecast for any new measurement can be read off directly, before the measurement exists. Reading the box back at today’s measurement returns 90.0%, matching the reference 90.1%.
 Click to enlarge
Where a new central value for Andromeda’s drift would move the forecast. Left: if the new measurement is about four times more precise than today’s (2 μas/yr). Right: if precision stays at today’s level. Blue star: today’s value. Red square: the value used in the 2025 forecast. Black triangle: a perfectly head-on approach.
Produced by Prabhu’s Deep Space Labs from our own runs (1 November 2026) of the published Sawala et al. model with the Wu et al. (2026) inputs. The method follows Wu et al. (2026, Fig. 5); this is not a figure taken from either paper.
HOW TO READ THIS MAP
Each point on the map is a possible answer to one question: “Which way, and how fast, is Andromeda drifting across our sky?” Left to right is drift toward the east; bottom to top is drift toward the north. The units are micro-arcseconds per year—at Andromeda’s distance, one unit is about 3.7 km/s of real sideways speed.
- The colour says what happens to the 90.1% forecast if a new measurement is centred on that point: blue raises it, grey leaves it essentially unchanged, red lowers it.
- The dotted ellipses show today’s uncertainty: Andromeda’s true drift is probably inside the small one and very probably inside the large one.
- The dashed circles are Andromeda’s sideways speed relative to the Milky Way: 20, 50, 80, and 110 km/s. Their centre, the black triangle, is a perfectly head-on approach.
- The dark red line marks 50%. Outside it, a merger becomes less likely than not.
Why two maps? The forecast averages over the whole uncertainty range. A blurry measurement includes some fast sideways drifts that miss, and those pull the average down. So the same central value can give a different forecast depending on how sharp the new measurement is.
4Four predictions, stated in advance
- Precision alone moves the number. If new data confirm today’s value at 2 μas/yr, the forecast rises to about 95%, right at the raise boundary. Today’s 90.1% includes, inside its error bars, sideways speeds fast enough to miss; a sharper measurement at the same centre removes them.
- Most of today’s uncertainty range leaves the forecast unchanged. Across today’s inner ellipse, a 2 μas/yr measurement would give 86.9–95.8%. Across the outer ellipse, 69.9–95.8%.
- “Coin flip” needs a big surprise. The 50% line lies entirely outside today’s outer ellipse, at sideways speeds of roughly 80–110 km/s. Even a return to the value used in 2025 would lower the forecast to about 69% (56% at today’s precision), not to 52%, because the 2026 model’s other updated inputs stay frozen.
- Head-on is not the best case for a merger. A perfectly head-on approach gives about 91%, less than the 95% at today’s value. The Large Magellanic Cloud tugs the Milky Way as it falls in, and for a slightly oblique Andromeda orbit that tug pushes the two galaxies together. Wu and colleagues describe this LMC effect.
| If the new central value is… | Sideways speed | At 2 μas/yr | At today’s precision |
|---|---|---|---|
| Today’s value (45.9, −20.5) | 26 km/s | 95.4% Raise, borderline | 90.0% Unchanged |
| The 2025 input (48.9, −36.9) | 67 km/s | 69.3% Lower | 55.9% Lower |
| Perfectly head-on (38.8, −21.4) | 0 km/s | 91.0% Unchanged | 88.7% Unchanged |
Drift values are heliocentric, in μas/yr (east, north). Sampling error is 0.3–0.5 points at today’s precision and 0.8–1.7 points at 2 μas/yr. Sideways speeds are in the model’s frame, at Andromeda’s central distance and approach speed.
5The rule for the update
- Wait for a real measurement. The update uses the first Andromeda proper motion derived from Gaia DR4 data and posted on arXiv or in a refereed journal, with stated uncertainties. Gaia does not publish one directly; it has to be derived, so this may take weeks to months.
- Substitute only that measurement. Replace Andromeda’s drift and its uncertainty in the frozen inputs. Change nothing else: same code, other inputs, seeds, sample size, horizon, and merger definition.
- Publish beside the original. Show the new forecast next to 90.1%, its category, and what this page predicted for that value—and explain any disagreement.
- Keep improvements separate. A new Triangulum (M33) measurement, model fixes, or any other change is a separate, labelled update, never folded into the first.
The 5-point threshold was committed to a public repository before the map was computed. That ordering is the whole value of this page: had I set the bar after seeing the map, any result could have been framed as expected.
Set the bar before you see the result, and put the timestamp where others can check it. Every review, launch, or experiment has a moment when the data arrive. The decision about what would count as success belongs before that moment, not after.
What This Is, and Isn’t
- Not a new model. It is the published Sawala et al. (2025) model with the Wu et al. (2026) inputs. Wu and colleagues first published the probability map across Andromeda’s drift. What this page adds is the advance commitment, open code, and a public update.
- Conditional numbers. Every percentage assumes this model and its inputs. No merger within 9.8 billion years is not the same as no merger ever.
- Known model limits stay in. Rigid dark-matter halos, a 20 kpc merger flag, and a friction term that reverses sign near typical close passes are tested in the next stage, not changed in the first update.
- Reproducible. The code, inputs, seeds, and results are in the andromeda-research repository under the tag
pre-dr4-forecast-v1, with a technical forecast note.
Sources
- Wu, H. et al. (2026). The Fate of the Milky Way–Andromeda System: To Merge or Not? Accepted, ApJ Letters. arXiv:2603.22863
- Wu, H. et al. (2025). Revisiting the proper motions of M31 and M33 using massive supergiant stars with Gaia DR3. A&A 701, A265. doi:10.1051/0004-6361/202555477
- Salomon, J.-B. et al. (2021). The proper motion of Andromeda from Gaia EDR3: confirming a nearly radial orbit. MNRAS 507, 2592. arXiv:2012.09204
- Sawala, T. et al. (2025). No certainty of a Milky Way–Andromeda collision. Nature Astronomy 9, 1206. doi:10.1038/s41550-025-02563-1
- ESA. Gaia data release scenario. cosmos.esa.int/web/gaia/release
- Sawala, T. MW-M31 public research code. github.com/TillSawala/MW-M31 (GPL-3.0)