Andromeda: How Certain Is Our Galactic Future?
Same model, one updated measurement, opposite headlines
On a dark night, Andromeda is a faint smudge: the nearest large galaxy, about 2.5 million light-years away, and one of the most distant objects the naked eye can see. Most of us grew up with a simple story about it: Andromeda is heading straight for us, and in about four or five billion years the two galaxies will collide.
In 2025 a team led by Till Sawala re-ran that forecast with modern data and found it was closer to a coin flip. In March 2026 another team, led by Hao Wu, used largely the same model with a re-measured motion for Andromeda and found a 90% chance. Neither result is wrong. They answer the same question with different inputs, and the difference is the most interesting part of the story.
This page follows that difference. I have reproduced both forecasts from the published code, and before Gaia’s next data release I will publish a dated forecast stating, in advance, what new measurements would change it.
1The blueshift is mostly us
In 1912 Vesto Slipher measured Andromeda’s spectrum and found it shifted toward blue: the galaxy is approaching. Relative to the Sun, it approaches at about 300 km/s. But the Sun itself is orbiting the centre of the Milky Way at about 250 km/s, and part of that orbit carries us toward Andromeda. Measured galaxy to galaxy, the approach is only about 110 km/s.
Most of the famous blueshift is our own motion. The galaxies are approaching each other, but more gently than the raw number suggests.
2The sideways motion decides everything
Approaching does not mean colliding. Two ships heading toward each other can still pass side by side. What matters is Andromeda’s sideways motion across our sky, its proper motion, and it is extraordinarily small. The conversion from angular motion to speed is:
v⊥ [km/s] = 4.74 × μ [mas/yr] × D [kpc]
HOW TO READ THIS EQUATION
Stand on a bridge and watch two cars. One is close, one is far away. Even if both drive at the same speed, the far one looks slower: it creeps across your view. To work out how fast a distant thing is really moving sideways, you need two numbers: how fast it seems to creep across your view, and how far away it is.
- v⊥ is the real sideways speed we want, in kilometres per second.
- μ (the Greek letter “mu”) is how fast Andromeda appears to creep across the sky, its proper motion. It is measured in milliarcseconds per year, tiny slices of an angle.
- D is the distance, in kiloparsecs. One kiloparsec is about 3,260 light-years.
- 4.74 is just a unit converter. It turns “angle per year times distance” into “kilometres per second”, the way 2.54 turns inches into centimetres.
Worked example for Andromeda:
D = 780 kpc
v⊥ = 4.74 × 0.010 × 780 ≈ 37 km/s
So a creep across the sky that is far too small for any eye or ordinary telescope to see still means Andromeda is sliding sideways at about 37 km/s—roughly 130,000 km/h. Because Andromeda is so far away, even the tiniest measurement error in μ turns into a big difference in speed, and that difference decides whether the galaxies meet head-on or swing past each other.
At Andromeda’s distance of about 780 kpc, a sideways drift of just 10 micro-arcseconds per year—roughly the width of a coin seen from about 500,000 km away, a bit farther than the Moon—corresponds to about 37 km/s. Current measurements carry uncertainties of about 7 to 8 micro-arcseconds per year in each direction. That is enough to separate a head-on approach from a wide pass.
3Same model, one key input, opposite headlines
Both published forecasts use the same approach: represent the four largest galaxies of our neighbourhood (the Milky Way, Andromeda, Triangulum/M33, and the Large Magellanic Cloud) as dark-matter halos, sample their uncertain masses, distances, and motions 10,000 times, and integrate every possible future for about ten billion years. I ported the published code, tested it line by line against the original, and re-ran both studies:
How the simulation works, in plain words
Think of a weather forecast that says “70% chance of rain”. Forecasters don’t know today’s air exactly, so they run their model many times with slightly different starting conditions and count how often it rains. This forecast works the same way.
- Start from measurements, with their error bars. Every input—each galaxy’s mass, distance, and motion—is known only within a range. The model picks one plausible value for each, within the measured range.
- Let gravity play forward. Starting from today, the computer moves all four galaxies forward one million years at a time, pulled by each other’s gravity, for about ten billion years: 10,000 small steps.
- Add the drag. Each galaxy sits inside a huge cloud of dark matter. When one galaxy moves through another’s cloud, it leaves a gravitational “wake” behind it that pulls it back, like a boat slowing in thick water. Astronomers call this dynamical friction. It is what lets two galaxies that pass close spiral in and merge, instead of flying apart.
- Repeat 10,000 times. Each run gets a fresh set of plausible inputs. If 9,010 of 10,000 runs end in a merger, the forecast is about 90%.
The percentage is not a guess. It is a count of how often the model’s futures end in a merger, given what we currently know. When the measurements improve, the range of plausible inputs narrows, and the percentage can move—which is exactly what happened between 2025 and 2026.
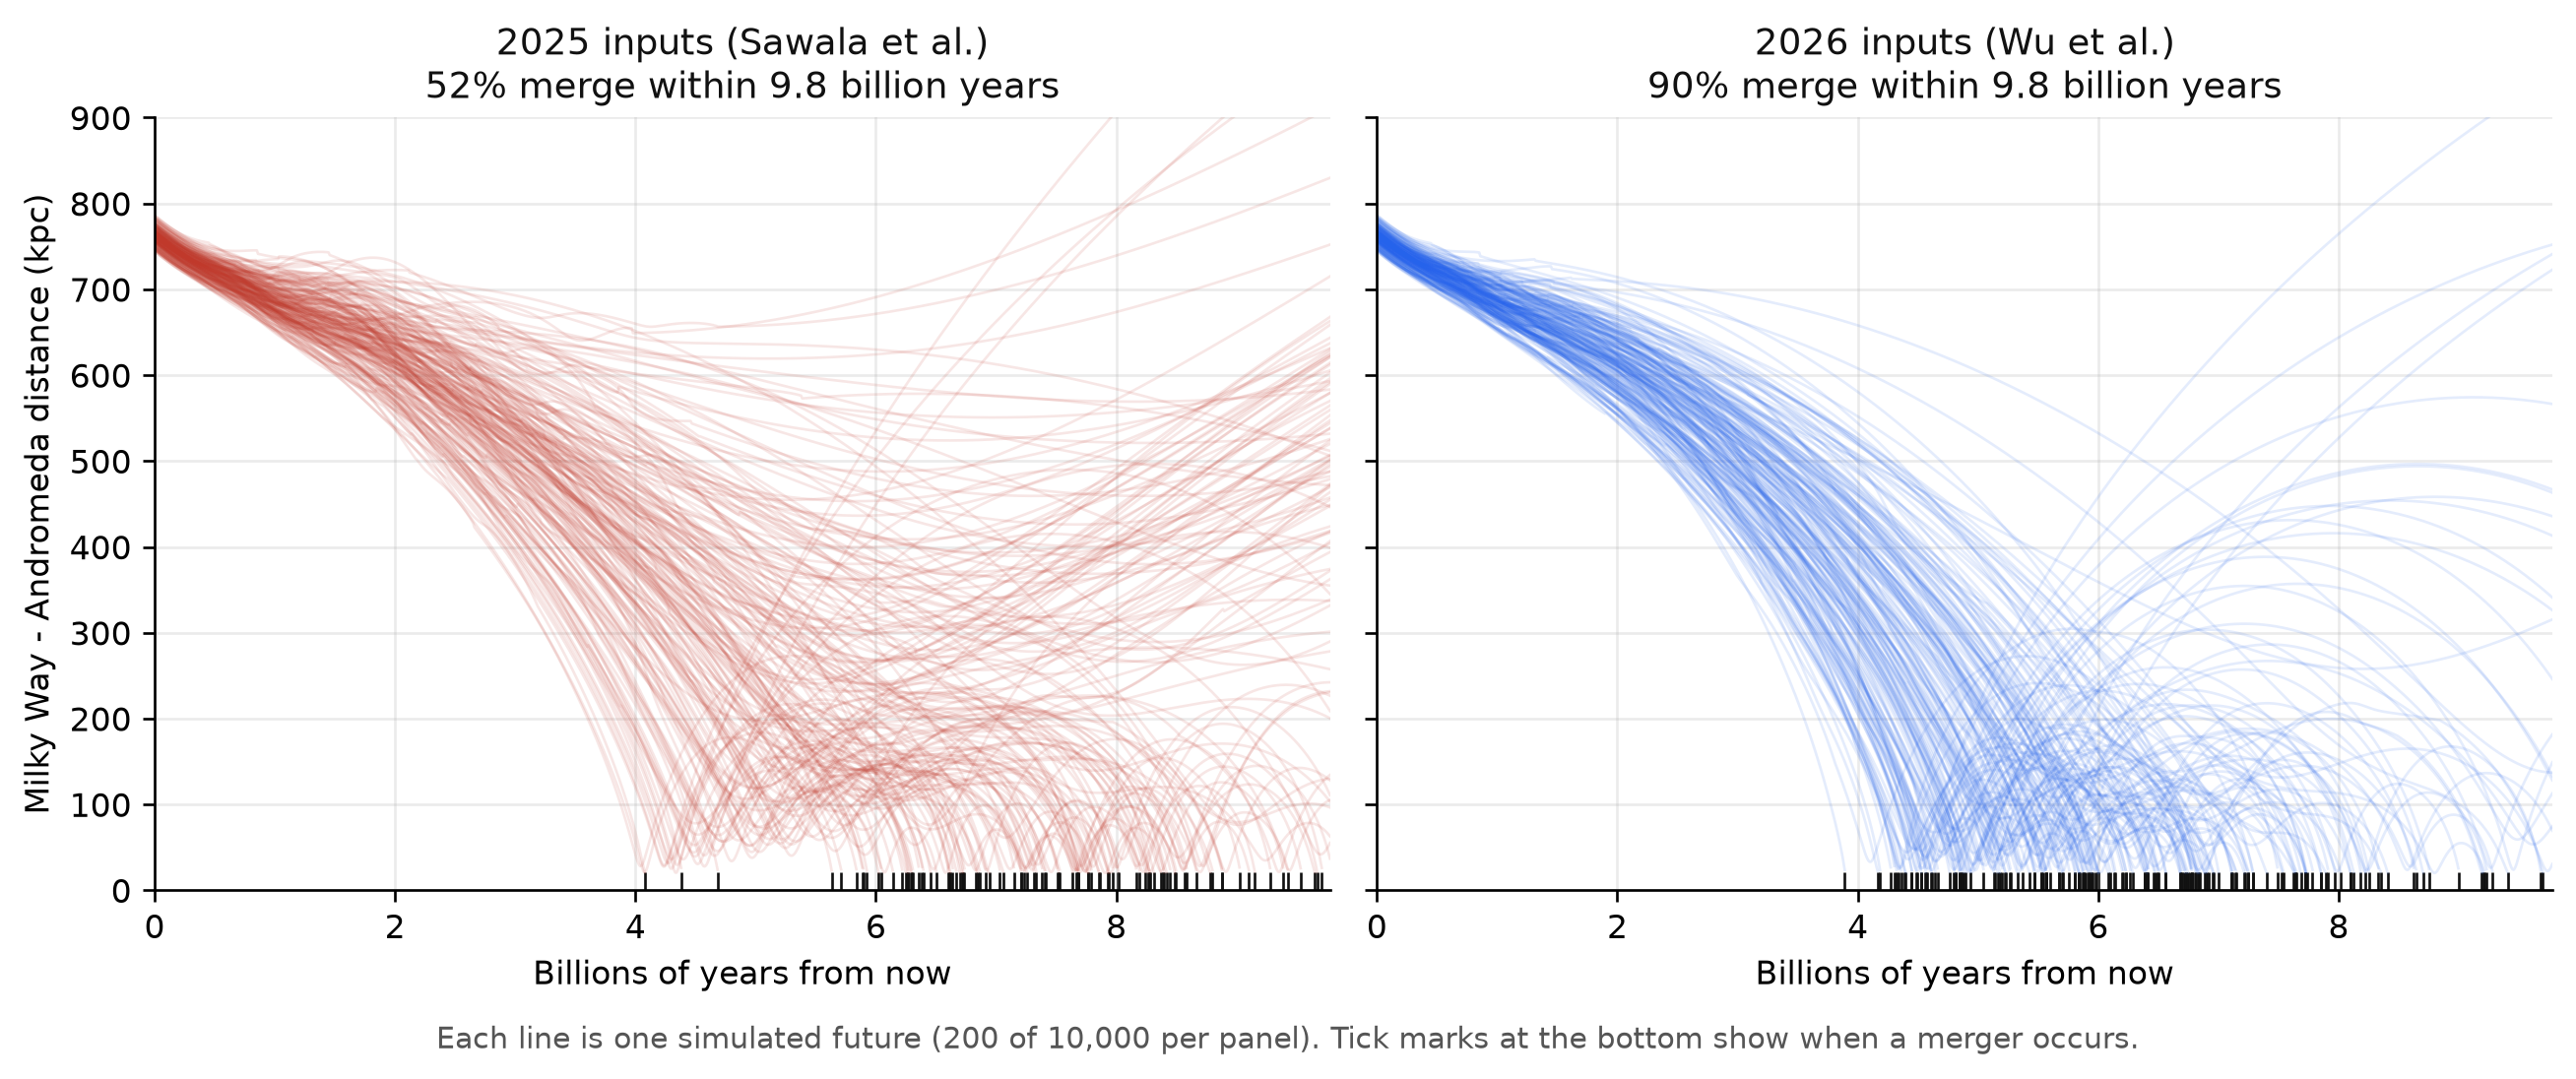 Click to enlarge
Each line is one simulated future of the Milky Way–Andromeda distance (200 of 10,000 per panel). Tick marks show when a merger occurs. Left: 2025 inputs. Right: 2026 inputs, with Andromeda’s motion re-measured.
Produced by Prabhu’s Deep Space Labs from our own reproduction runs (28 October 2026) of the published Sawala et al. model, using each paper’s inputs. This is not a figure taken from either paper.
| Quantity | 2025 inputs (Sawala) | 2026 inputs (Wu) |
|---|---|---|
| Merger within 9.8 billion years: my reproduction | 52.3% | 90.1% |
| Merger within 9.8 billion years: published | just over 50% | 90% |
| Typical merger time, if they merge | 7.4 billion years | 6.4 billion years |
| Andromeda’s sideways motion used (μα*, μδ), μas/yr | 48.9, −36.9 | 45.9, −20.5 |
The main change is one input: Andromeda’s proper motion. In 2025, Wu and colleagues traced a long-standing disagreement in Gaia measurements of Andromeda to a calibration difference between two kinds of Gaia astrometric solution. Correcting it gave a smaller sideways speed, a more head-on orbit, and a much higher chance of merging. (The 2026 study also adjusted Andromeda’s halo concentration and Triangulum’s motion; separating their effects is part of the next stage.)
Percentages are the fraction of simulated futures that merge within the model horizon. They are conditional on the model and its inputs, and the two results should not be averaged.
4Our next galactic collision isn’t Andromeda
The Large Magellanic Cloud, the bright satellite galaxy visible from the southern hemisphere, falls into the Milky Way first. In both reproductions it merges with our galaxy in essentially every simulated future, typically about 1.2 billion years from now (most futures between 0.9 and 1.8 billion years). That merger happens long before any encounter with Andromeda, and it nudges the Milky Way’s own motion enough to change the Andromeda forecast—in opposite directions depending on Andromeda’s exact path.
5Three clocks
“Will Andromeda hit us?” quietly assumes that “us” will still be here, unchanged. Three clocks run on very different timelines:
Earth’s biosphere
The Sun brightens slowly as it ages. Earth’s surface is expected to become uninhabitable long before any galactic encounter. The timing depends on climate models; I will cite those estimates in a later update.
The Sun
The Sun is too light to become a neutron star. It will swell into a red giant and end as a white dwarf. One detailed solar model places the red giant’s largest size about 7.6 billion years from now.
The galaxies
The LMC merges in about 1.2 billion years. Andromeda’s first close pass comes in about 5 billion years in the 2026 model, and a merger, if it happens, typically about 6.4 billion years from now.
Our home is likely to be transformed by the Sun long before Andromeda arrives. Placing these clocks on one timeline is a later stage of this research.
6A forecast with a date on it
ESA plans to publish Gaia Data Release 4 on 2 December 2026, with 66 months of observations. Better proper motions for Andromeda will follow—not on release day, since deriving them takes careful analysis, but in the weeks and months after.
Before 2 December, I will publish:
- The reproduced merger probability under current data, with its uncertainty.
- A map of how the probability changes across Andromeda’s possible sideways motions.
- Which new measurements would raise it, lower it, or leave it essentially unchanged—stated in advance.
- A fixed rule for the update: substitute the new proper motions, change nothing else, and show the result beside the original forecast.
The probability map itself has already been published by Wu and colleagues. What this page adds is the commitment in advance, and the open update afterwards.
Two capable teams, largely the same model, and essentially one changed measurement turned “coin flip” into “likely”. Neither team was careless. The forecast was simply most sensitive to the input that was hardest to measure.
Know which input your decision is most sensitive to, and say in advance what evidence would change your mind. A forecast becomes useful not when it sounds certain, but when everyone can see what would move it.
Method and Limitations
- Model. A semi-analytic model from Sawala et al. (2025): four galaxies as softened point masses with NFW dark-matter halos, Chandrasekhar dynamical friction, and a merger declared when two galaxies come within 20 kpc. Not a full simulation of stars and gas.
- Reproduction. A vectorized port of the public code (commit
e04820e), tested against the original notebook’s own functions; 10,000 samples per configuration. - Time units. The published code’s time unit is 0.978 billion years, labelled as one billion. This page reports physical years: the published “10 Gyr” horizon is 9.8 billion years.
- Uncertainty shown. Monte Carlo sampling error on the merger fractions is under one percentage point. Model and systematic uncertainty is larger and is the subject of a later stage. For example, the model’s friction term reverses sign at separations of about 20–32 kpc, close to typical first passes, and its effect has not yet been tested.
Sources
- Sawala, T. et al. (2025). No certainty of a Milky Way–Andromeda collision. Nature Astronomy 9, 1206. doi:10.1038/s41550-025-02563-1
- Wu, H. et al. (2026). The Fate of the Milky Way–Andromeda System: To Merge or Not? Accepted, ApJ Letters. arXiv:2603.22863
- Wu, H. et al. (2025). Revisiting the proper motions of M31 and M33 using massive supergiant stars with Gaia DR3. A&A 701, A265. doi:10.1051/0004-6361/202555477
- van der Marel, R. P. et al. (2012). The M31 Velocity Vector. III. ApJ 753, 9. arXiv:1205.6865
- Schröder, K.-P. & Smith, R. C. (2008). Distant future of the Sun and Earth revisited. MNRAS 386, 155. arXiv:0801.4031
- ESA. Gaia data release scenario. cosmos.esa.int/web/gaia/release
- Sawala, T. MW-M31 public research code. github.com/TillSawala/MW-M31 (GPL-3.0)